
Concepts
This page provides an overview of Senfi concepts.
Contents
Measurement, Metric, Tag
Measurement
Senfi deals with data in a time series. Each record in this time series consists of:
- a timestamp indicating when the data was sampled (in milliseconds)
- a fixed set of tags
- a fixed set of metrics
All these records are kept in a dataset called a measurement.
Metric
A metric is a discrete reading or unit of data. It can be produced/measured by sensors, equipment, or complex systems. An example of a metric is temperature (eg. 37). A metric may or may not have units associated (eg. degrees Celsius).
Tag
A tag is an attribute of the sample. It is usually used as a way to identify where is the metrics are taken from (eg. device ID). It is also useful for labelling the data being sent, in order to perform operations on the data later, eg. filtering.
Example
Say you have a smart weighing scale at home. One possible way to represent the time series data for the device is as follows:
- Measurement
- Smart Weighing Scale
- Measurement code
- iot_weighingscale_v1
- Data
| tm_source | weight_kg |
|---|---|
| xxxxxxxxxxxxx | 70.1 |
| xxxxxxxxxxxxx | 70.4 |
| xxxxxxxxxxxxx | 69.4 |
tm_source represents when the reading was taken. In this case, weight_kg is the metric, and is sent everytime a weight is taken.
This is well and good, but what if there is another person who's using the weighing scale? One way to distinguish them apart is by adding an additional field, or tag, called person:
| tm_source | person | weight_kg |
|---|---|---|
| xxxxxxxxxxxxx | Sam | 70.1 |
| xxxxxxxxxxxxx | Susan | 55.2 |
| xxxxxxxxxxxxx | Sam | 70.4 |
Much better. But what if there are multiple weighing scales in the house? We can tell them apart by adding another tag:
| tm_source | room | person | weight_kg |
|---|---|---|---|
| xxxxxxxxxxxxx | bathroom | Sam | 70.1 |
| xxxxxxxxxxxxx | kitchen | Susan | 55.2 |
| xxxxxxxxxxxxx | kitchen | Sam | 70.4 |
So we end up with a measurement that has 2 tags (room, person) and 1 metric (weight_kg).
A more complete example can be as follows:
| tm_source | site_id | room | person | weight_kg | bodyfat | battery_level |
|---|---|---|---|---|---|---|
| xxxxxxxxxxxxx | 1547 | bathroom | Sam | 70.1 | 19.1 | 99 |
| xxxxxxxxxxxxx | 1547 | kitchen | Susan | 55.2 | 15.3 | 54 |
| xxxxxxxxxxxxx | 1547 | kitchen | Sam | 70.4 | 19.2 | 49 |
This example is admittedly contrived, but it serves as an example of how data can be modelled in Senfi.
Asset
Unlike applications like Prometheus or InfluxDB which deals purely with temporal data in a time series, Senfi associates such data with physical objects in the real world.
An asset in Senfi represents a physical object/system of interest. An asset may produce one or more measurements, or it may not produce any measurements. Read more about assets here.
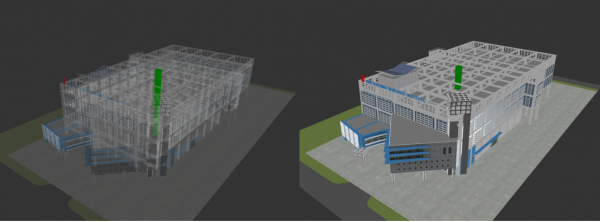
Site
A site represents a place whereby sensors are physically located. A site usually comprise of one or more buildings. A site in Senfi has a geographical location and usually a 3D representation. Users may choose to use the CMS to trace out the building outline and generate a quick 3D building, or they can also upload a 3D building modelled using modelling software such as Autodesk 3DS Max, SketchUp etc.

site_id is a unique integer associated with a particular site. It is used as a tag when sending measurements to Senfi, so that Senfi can tell which site the incoming measurement is meant for.
Rule, Alert
In an operating environment such as a smart building, it is important that organizations are able to keep track and be aware of what is going on in and around their assets. The way to do that is through monitoring and alerting.
Sensors produce measurements which contain data in the form of metrics and tags. Senfi provides multiple ways for users to monitor metric and tag values for conditions which require attention - such as abnormally high values, or when a combination of values indicates something is down - and to take action when it happens.
Rule
User can make use of Senfi's flexible rule engine to be alerted of abnormality in the system they are monitoring.
A rule in Senfi comprises of:
- Inputs
- Conditions
- Output
- Actions
- Rule execution options
Example
Using our Smart Weighing Scale measurement from earlier, we can form one simple rule as follows:
- Input: iot_weighingscale_v1.battery_level
- Condition: < 20
- Action: Email reminder to replace battery
- Rule execution option: Immediately (means evaluate this rule whenever there is any incoming measurement)
Computed measurement
Frequently, incoming metrics represent raw values that are read from the sensing device (eg. door open status, door closed status). To be able to derive better insights and to formulate more complex rules, it is useful to be able to calculate new metrics that are derived from the raw metrics. We refer to these metrics as derived metrics. The set of derived metrics and associated tags form the computed measurement.
Similar to measurement, a computed measurement comprises of:
- timestamp
- tags
- metrics (derived)
Following from the above example, a computed measurement could compute the duration that a door remains opened by taking the timestamp between a door open and door closed metric.
Organization, User, Access Group
An organization represents the entity (eg. company, individual) that is responsible for managing the account that uses Senfi. An organization comprises at least one user with Administrator role. Users with Administrator role are able to manage other users, including user account creation/deletion, user roles etc.
Think of access group as a subset of the assets under the organization. Users can be placed into access groups to have access to those assets. Currently assets that can be assigned to an access group are:
- user
- site
- rule